We expected latency to be one of the least controversial metrics in our agent evaluations. Unlike task success or trajectory quality, it seemed to require little judgement. An agent started, some time passed, and it finished.
Easy. Or so we thought.
A slow trial could mean a slow model response, a long-running tool call, a slow environment setup, repeated attempts after a failure, or validation at the end of the run. Some of those operations executed sequentially, and others executed partially or completely in parallel. To add more complexity, depending on how we computed start and end timestamps, the same execution could produce several different latency measurements.
We had to standardize all these measurements so we could find out where all that time was going.
What is latency?
Latency measures how long an agent, or an operation within its execution, takes to complete. For AI agents, latency isn't one metric. It's a family of measurements, each of which has its own limitations and utility. In our previous post on evaluation traces, we described a trial as one end-to-end run of a task. For us at Quantiles, that makes task latency the most useful starting point. It gets closest to one of the biggest questions users actually care about: how long will this task take?
Below is an example where time is spent during a Quantiles evaluation task:
qt run my-evaluation12.8 sqt show 1 --json0.4 sBut faster is not necessarily better. An agent that finishes in 20 seconds and fails is not more useful than one that takes 30 seconds (or more!) and succeeds. Rather than asking which agent is fastest, we look at how long it takes to complete a task reliably. Success rate, median latency for successful trials, and tail latency can show that relationship without collapsing it into a single score.
Latency breakdown
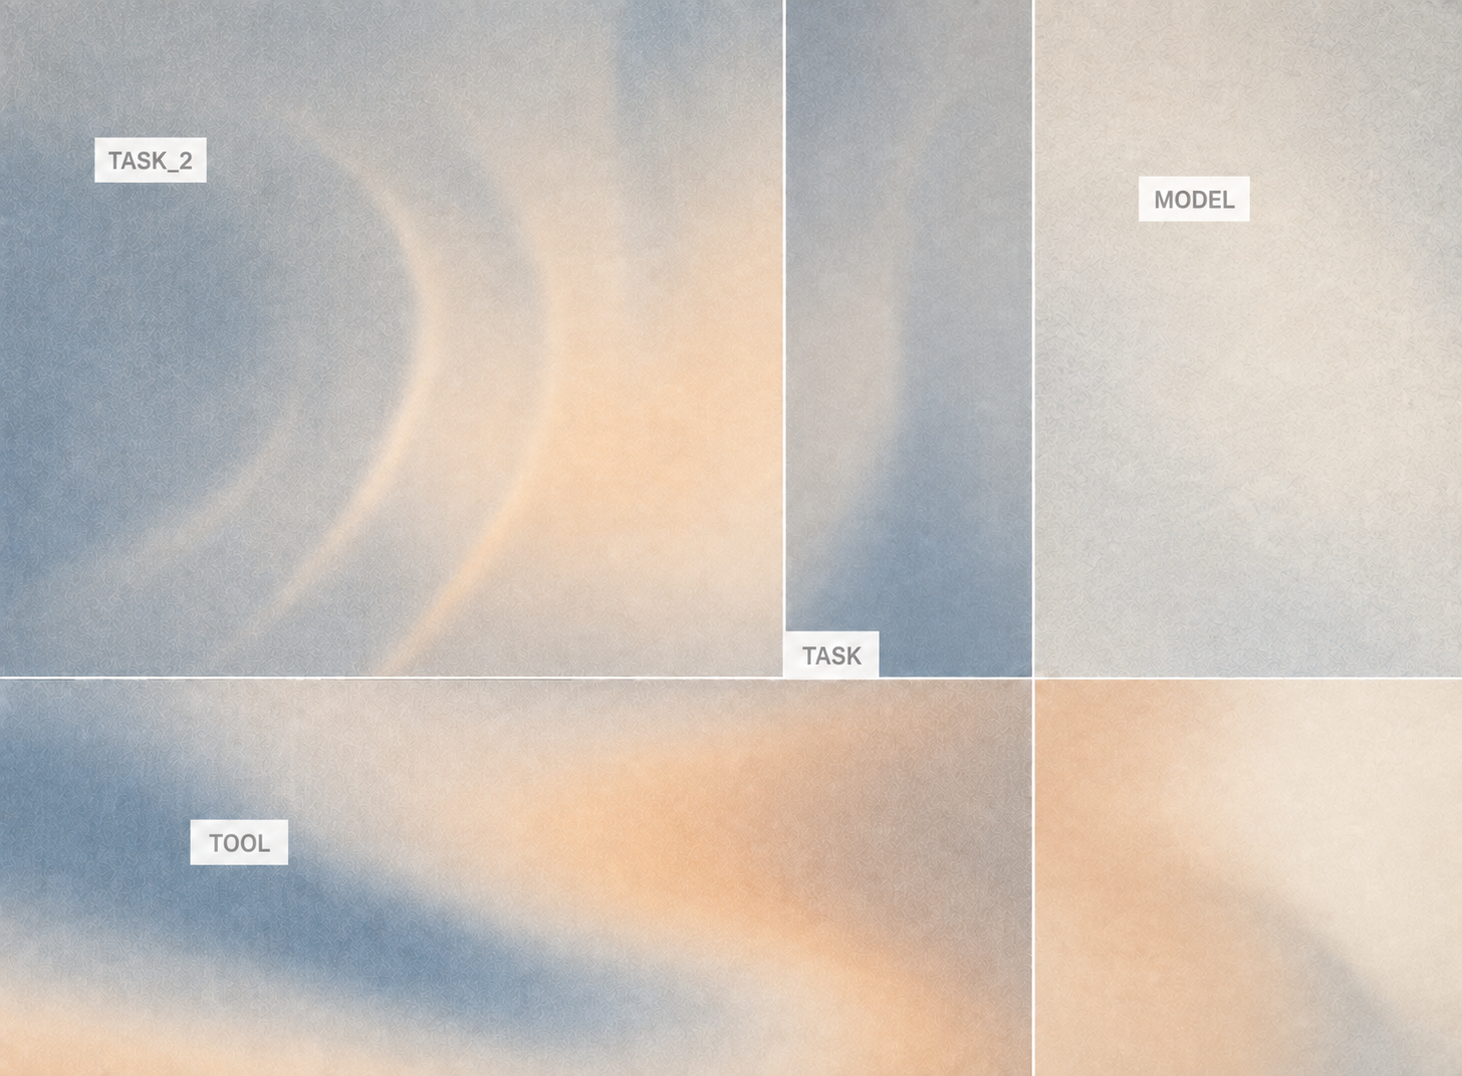
At a high level, the trace shows where trial latency goes across model time, tool time, and orchestration or wait time. Across repeated trials, though, latency becomes a distribution, and agent workloads tend to have long tails. A number of things like a package install, timeout, permission request, or ambitious repository search can turn a normal run into a very slow one.
The slowest trials are not necessarily representative, but they are often diagnostic. They show us where latency and reliability begin to deteriorate. We thus report mean, p50 (average), p95, and p99 statistics alongside the eligible trial count, timeouts and failures. We also slice the distribution by task type and complexity. Together, these measures show both typical performance and the slow paths an agent can potentially take.
The following table is an example of model, tool, and orchestration tasks that can contribute to the latency of a task.
| Task item | What it measures | Task type |
|---|---|---|
| First token or chunk | Model request to first streamed output | Model |
| Response generation | First streamed output to completed model response | Model |
| Repository search | Search invocation to returned matches | Tool |
| File read | Read request to returned file contents | Tool |
| File edit | Edit request to completed file update | Tool |
| External API request | API tool invocation to returned response or error | Tool |
| Dependency installation | Install command start to completion or failure | Tool |
| Build | Build command start to completion or failure | Tool |
| Test execution | Test command start to results or failure | Tool |
| Environment provisioning | Environment requested to ready for execution | Orchestration |
| Scheduling delay | Operation ready to run to dispatch | Orchestration |
| Retry backoff | Failed attempt to the next retry attempt | Orchestration |
| Rate-limit wait | Rate limit encountered to permission to retry | Orchestration |
| Context preparation | Start to finish of assembling input for the next model request | Orchestration |
| Human approval wait | Approval request to human response | Orchestration |
Model inference latency
The model is an obvious place to look when a trial is slow. Model inference time captures the latency of the inference requests made during the trial, but even that metric really has multiple underlying measurements. Time to first token tells us how quickly the model begins responding, while generation time captures how long it takes to produce the complete response. Across an agent run, multiple model requests can contribute to the total time spent waiting on inference.
Time to first token is especially useful for understanding responsiveness, but it tells us surprisingly little about how much model time a task will ultimately require to complete. A model can start streaming tokens almost immediately and still generate a very high-latency response. An agent can also call models repeatedly as it works through the task, so we look at both the latency of individual model requests and the cumulative model time across trials.
Tool time
Tools were the next place we looked when a trial ran long. A coding agent can spend time doing a wide variety of tasks, including:
- Searching a repository
- Reading and writing files
- Running shell commands
- Calling MCP tools
- Installing dependencies
- Writing code
- Running tests
Once we built tools to distinguish these operations in agent traces, we could understand how long individual tool calls took and how much of the trial was spent calling and waiting for tools.
Tool latency metrics have gotchas, though. Ten one-second calls in sequence, and two five-second calls in sequence both add up to ten seconds, but they tell different stories. A few long calls might come from an expensive build or test suite. Many short calls might imply repeated searches, retries, or other steps in the agent’s trajectory. To help us see these differences, we looked at tool-call count and per-call latency alongside total tool time. Knowing that an agent spent ten seconds in tools was useful, but also knowing what it did with the outputs of those tools is much those ten seconds is much more actionable.
Orchestration and wait time
Beyond tool calls and model inference calls, an agent can spend time in a trial waiting for operations to start or finish, handling retries and backoff, moving data, or waiting for the evaluation environment itself. Once we accounted for model inference and tool call time, these gaps in the trace stood out. They can be harder to interpret because they often reflects the system around the agent rather than one expensive, easy-to-explain operation.
A few hundred milliseconds between steps may be normal orchestration overhead. Long or repeated gaps can point to:
- Scheduling delays
- Rate limits
- Resource contention
- Synchronization
- An environment that is slow to start or respond
Full agent traces help us see where those gaps appear and what happened immediately before and after them. Sometimes the slowest part of an agent run, we learned, is simply waiting for the next thing to happen.
Latency Measurement in Real Agent Systems
Current coding agents provide a useful view of how latency is measured in real systems, through their traces (sometimes also called their 'transcripts'). Rather than relying on one end-to-end number, they preserve separate timing measurements for model inference requests, tool calls, agent or turn execution, and other sources of delay. The boundaries between these different categories differ across systems, but we can be consistent in the approach we take to distinguish and measure them.
| Coding agent | Latency measurements | What it can reveal |
|---|---|---|
| OpenAI Codex | End-to-end turn duration, API-request duration, time to first token, and tool-call duration | Whether latency comes from model requests, tool execution, or the broader turn |
| Claude Code | Turn duration, model-request duration, time to first token, overall tool duration, tool-execution duration, and permission-wait duration | Whether a slow tool call comes from execution itself or time spent waiting for permission |
| Gemini CLI | Agent duration, API-request latency, tool-call latency, and tool validation, preparation, execution, and result processing | Whether latency comes from model requests or a particular stage of tool execution |
Conclusion
It's difficult to understand the cause(s) of a task's latency from just a single number. The overall latency of a trial (usually) tells us how long a user waits for work to complete, but the execution trace shows whether that time was spent on model requests, tools, retries, or the surrounding system. Looking at those measurements alongside success metrics and tail latency, across multiple trials, gives us more valuable data than than a simple ranking of which agent is fastest. These more 'advanced' data show what to optimize to achieve faster, more reliable AI products.